04. Common EHR Model Evaluation Metrics
Common EHR Model Evaluation Metrics
ND320 AIHCND C01 L04 A04 Common EHR Model Evaluation Metrics
Common EHR Metrics Key Points
For this course, we will assume some exposure to common evaluation metrics used for classification and regression. These terms should hopefully be familiar and we will not cover them fully, but here is a quick review.
Common Classification Metrics
- ** AUC - ROC Curve**: Receiver Operating Characteristic (ROC) curve shows a graph of the performance of a classification model. It is the True Positive Rate Vs. False Positive Rate across different thresholds. "Area under the ROC" (AUC - ROC) curve measures the entire two-dimensional area underneath the entire ROC curve.
- F1: Harmonic mean between precision and recall
- Precision: the fraction of relevant instances among the retrieved instances
- Recall: the fraction of the total amount of relevant instances that were actually retrieved.
Common Regression Metrics

Precision Recall Tradeoff
Precision-Recall Tradeoff
As a quick reminder, there is often some level of precision that you must align with and some capture rate or recall that you are trying to improve. This balance between the two is a necessary tradeoff and a key component that you must communicate with non-technical stakeholders who might have unrealistic views of the impact or capabilities of AI.
Brier Scores
One metric that you might not be familiar with is a Brier score and it is often used in weather forecasting for estimating the probability certainty of a forecast. It can be a useful metric for comparing the performance of algorithms based on the degree of confidence in a given prediction. This can be helpful because the confidence and measurement of uncertainty can yield vastly different interpretations.
For the actual definition, it is essentially the mean squared error of a given probability forecast and I walk through the formula step by step below. However, please note that you are not expected to know this formula or use it in this course because we are focusing on the predictions for a regression model. It is introduced as a relevant evaluation metric for if we had a binary classification problem with the associated prediction probabilities.
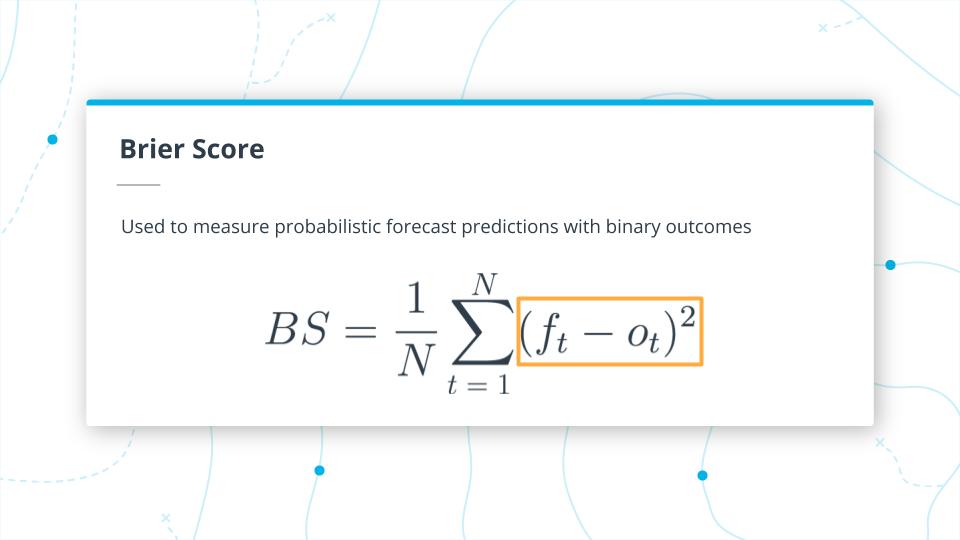
Brier Score Breakdown Part 1
Basically you take the probability forecast on a 0 to 1 scale which is f of t and subtract that from O of t which is the actual value which is a binary 0 and 1 value. You then square the difference of this value.
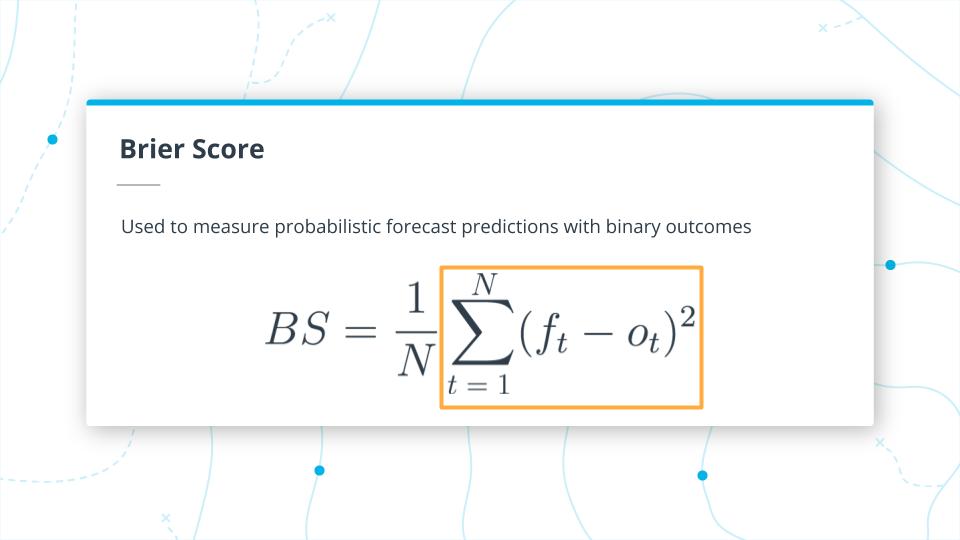
Brier Score Breakdown Part 2
- Take the summation of these squared differences from t=1 to N, the total number of predictions.
Brier Score Breakdown Part 3
- Then divide by N the total number of predictions
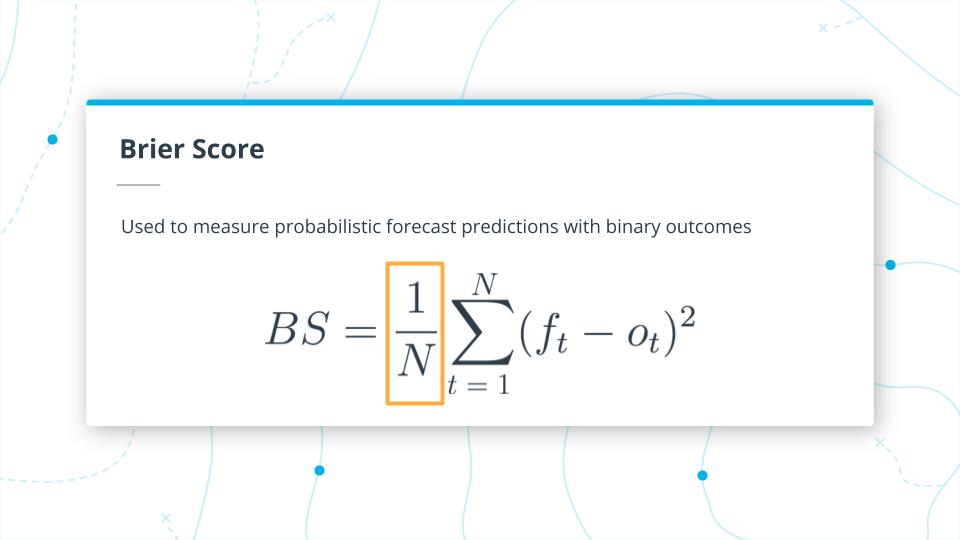
Brier Score Breakdown Part 4
The result is the Brier Score which ranges from 0 and 1.
- Lower is better
- 0 is the best score
- 1 is the worst score.
Code
If you need a code on the https://github.com/udacity.
Common Model Evaluation Metrics
SOLUTION:
- Area under the Receiver Operating Characteristic Curve
- Precision
- Recall
- RMSE
Brier Scores
SOLUTION:
- Brier scores are basically the mean squared error of probability forecast.
- The Brier Score provides an estimate of the probability certainty of a prediction